Searching trait data
Characterization and evaluation (C&E) data stimulates the use of germplasm collections. Since 2018, Genesys has provided access to C&E datasets from various genebanks for download and analysis by users. You can also search these datasets for specific traits directly within Genesys.
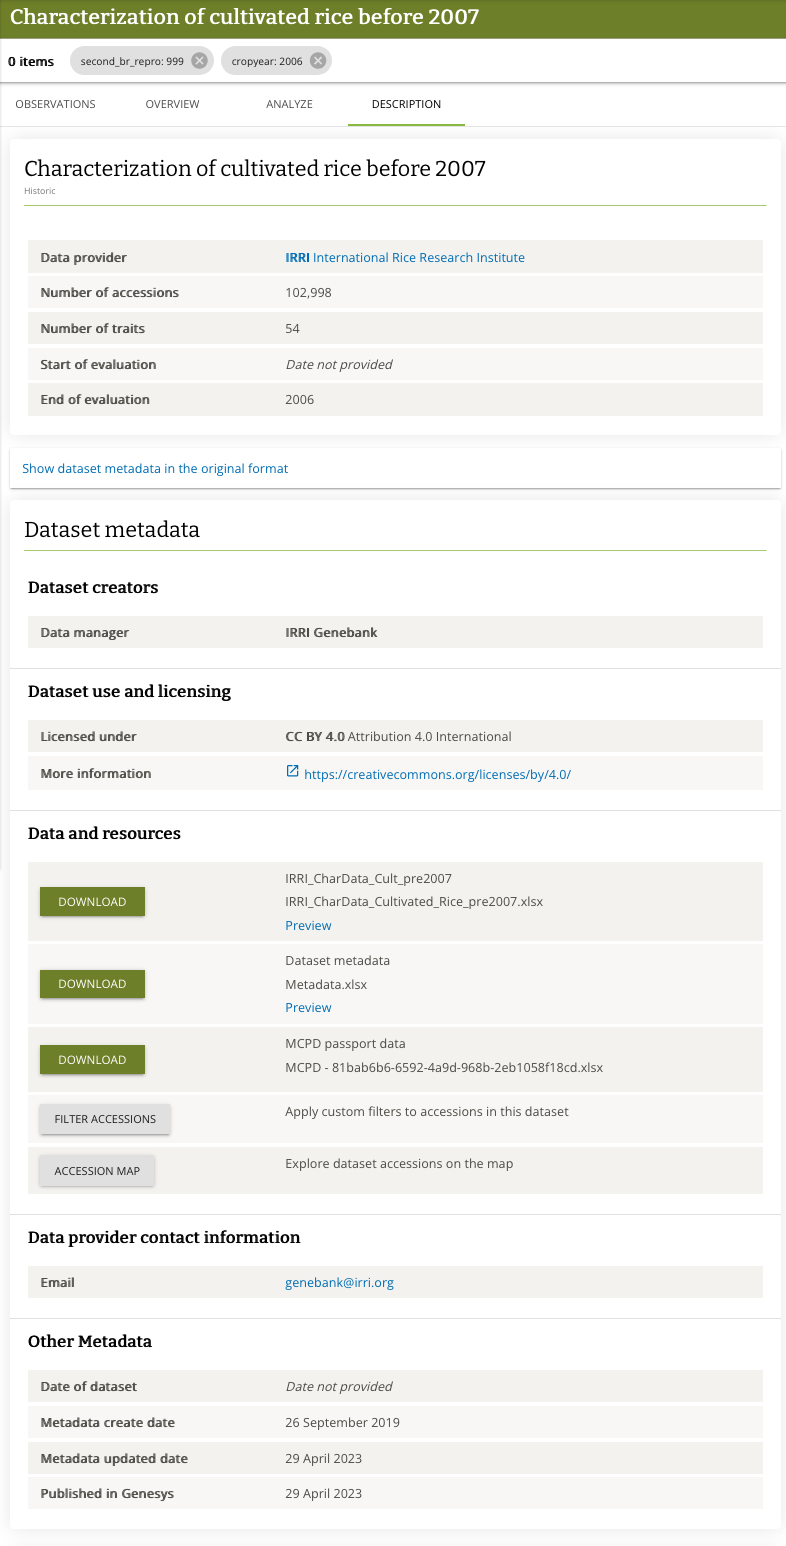
Be on the lookout for this green banner, once you click it, it redirects you to the searchable dataset.

Searchable datasets
Searchable datasets follow the familiar Genesys layout: the filtering options are listed on the left, and the main display area is used to show trait data that match the specified filters. The data are initially not filtered and the grid allows you to browse through the entire dataset.
Observations tab
The Observations tab displays trait data in a grid, one row per accession.
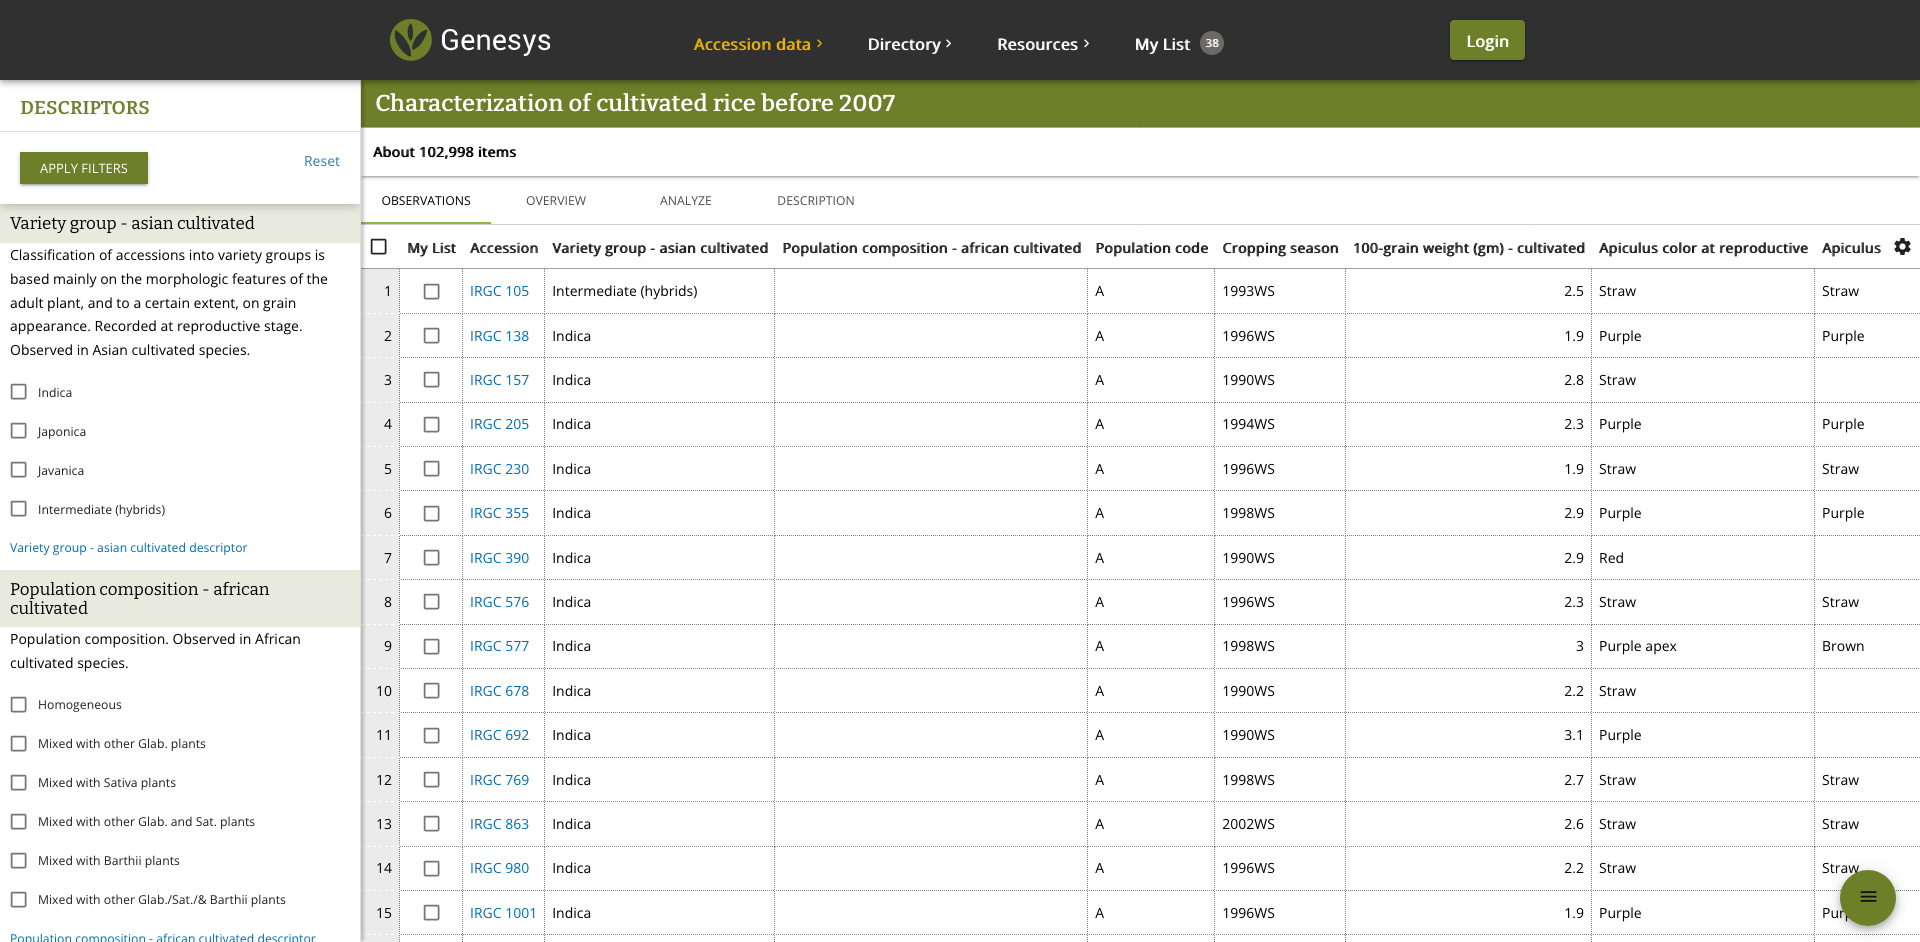
The first column (My List) indicates whether the accession is already in your list. Tick the checkbox to add it, and untick the checkbox to remove it.
The Accession column displays the accession number with a link to its passport data.
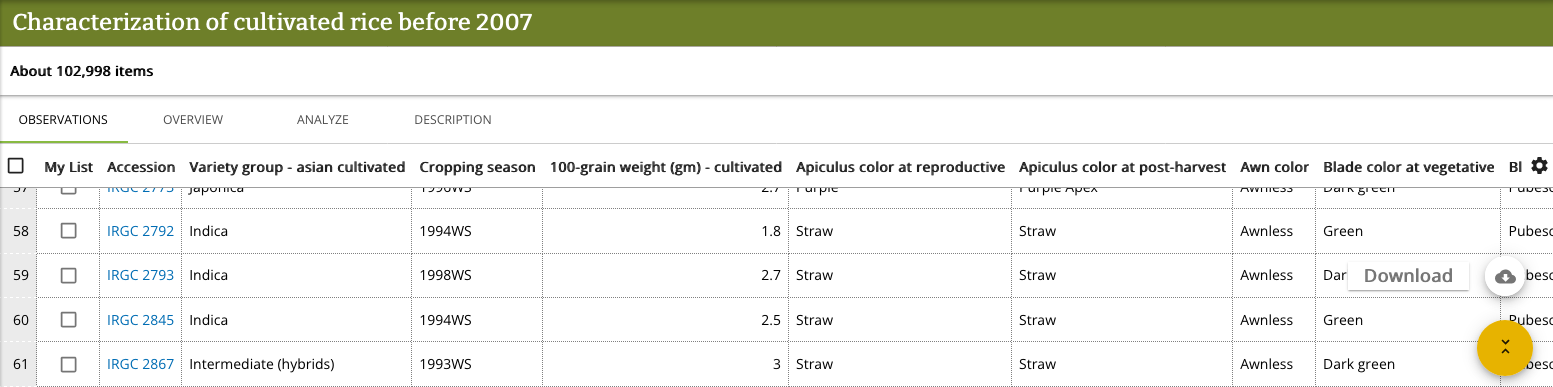
The gear icon on the right edge of the grid header allows you to toggle the visibility of columns and adjust their display: wrap text, apply heavier font weight, and adjust text alignment. You can close the grid settings by clicking or tapping on the Save icon.

Descriptor types
Crop descriptors document how the observations were recorded. The filtering options depend on the type of descriptor.
Coded descriptors
The most common type of descriptor in characterization data is coded. These are used to capture categorical data and specify what each code represents.

Numerical descriptors
Quantitative data from exact measurements (counts, lengths, widths, etc.) or their mean values use numerical descriptors. In addition to the methodology used to make the observations, these must specify the unit of measurement.
Numerical descriptors allow you to enter a value range, where At least means the observed value must be greater than or equal to this value (i.e. the minimum value) and At most requires that the trait value be less than or equal to the specified maximum.

Scale descriptors
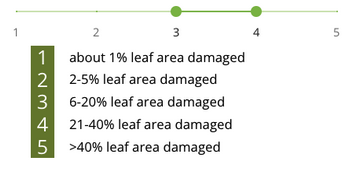
Numerical observations are sometimes normalized and expressed on a scale, for example from short to tall, or from susceptible to resistant. Such ordinal scale descriptors are often found in characterization and evaluation data. In the example below, the damaged area of leaves is not expressed as the exact percentage of leaf area, but as a scale where leaf damage goes from low damage (1) to extensive damage (5). You can adjust the range of interest by dragging the two circular buttons.
Text descriptors
Text descriptors are used for unstructured data such as notes and comments. Entering a value in a text filter will match accessions where the note contains the phrase specified in the filter (e.g. "2006" will match both "2006DS" and "DS2006").

Applying filters
Genesys does not automatically refresh the data in the grid when you set the trait filters. You must click or tap Apply filters for the filters to work.

Overview tab
After Observations, the tabs continue with Overview, Analyze (coming soon), and Description.
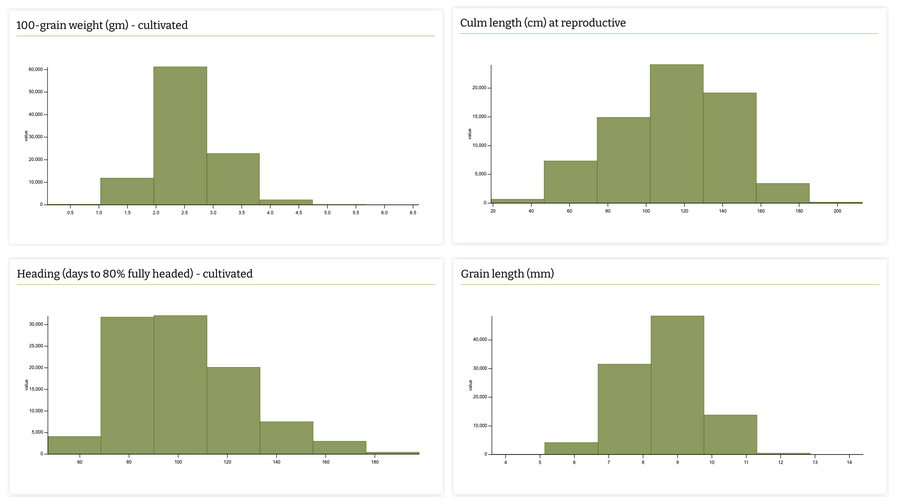
The Overview tab provides various visualizations of the data. Numerical traits are shown as histograms, while coded and scale descriptors use bar charts.